

📊 p50, p90, p99 Metrics: Why Averages Lie & Percentiles Rule
💡 "Our API latency is 200ms on average!" Sounds great, right? Until you realize 5% of users are waiting 5 seconds for a response. Averages lie. Percentiles tell the truth.


In this article, Obito & Rin break down:
✅ What p50, p90, p99 actually mean
✅ When to use each metric
✅ Instrumentation techniques to measure them
✅ Open-source tools for tracking percentiles
👩💻 Rin: "Obito, I keep hearing about p50, p90, p99 in performance monitoring. Are they just fancy ways of saying average response time?"
👨💻 Obito: "Oh no, Rin. Averages are liars. Percentiles tell you how bad things get for real users. Let me explain."
📈 What Do p50, p90, and p99 Actually Mean?
👨💻 Obito: "Percentiles show how long a request takes for a certain percentage of users.
MetricMeaningp50 (Median)50% of users experience this latency or fasterp9090% of users get a response in this time or fasterp9999% of users get a response in this time or faster (worst-case outliers)
👩💻 Rin: "So if p50 = 100ms, half of my users get a response in under 100ms?"
👨💻 Obito: "Exactly. But your p99 could still be 5 seconds, meaning 1% of users are suffering."

📌 When Should You Care About p50, p90, or p99?
👩💻 Rin: "Okay, but when should I care about p90 or p99 instead of just looking at p50?"
👨💻 Obito: "It depends on what you're measuring!"
🏎️ Example 1: Web Page Load Time (p50 vs p90)
✅ p50 → How fast most users experience your page
✅ p90 → Detects UI lag for slower users (maybe mobile users on slow networks)
🚨 If p90 is way higher than p50, slow users are suffering.
📌 When to Use?
p50 → Optimizing for common user experience
p90 → Checking slow users on bad networks
🌍 Example 2: API Latency (p90 vs p99)
✅ p90 → Good for general API health
✅ p99 → Identifies outliers (slow DB queries, cold caches, network spikes)
🚨 If p99 is much higher than p90, you have tail latency issues.
📌 When to Use?
p90 → Monitoring API stability
p99 → Detecting edge cases & worst-case performance

⚠️ Example 3: Load Testing (p99 vs p99.9)
✅ p99 → Checks worst-case latency
✅ p99.9 (p999) → Detects absolute worst outliers
🚨 If p999 spikes, it means 0.1% of users are having a horrible experience.
📌 When to Use?
p99 → Scaling servers before users complain
p99.9 → Checking worst-case performance under peak load
👩💻 Rin: "So p50 is fine for happy users, but p99 shows the pain points?"
👨💻 Obito: "Exactly! If you only look at averages, you’ll never see what's breaking for your worst users."
🛠️ How Do You Measure These Metrics? (Instrumentation Techniques)
👩💻 Rin: "Okay, but how do I actually measure p99 latency in real-world systems?"
👨💻 Obito: "You need to instrument your code. Here’s how:"
1️⃣ Application-Level Instrumentation
✅ Use logging & timers to capture response times.
✅ Store latency values and calculate percentiles in your own analytics.
📌 Example: Logging Latency in Python
import time

start = time.time()
handle_request()  # Your function/API call
latency = time.time() - start

log_latency(latency)  # Store for percentile calculations
👩💻 Rin: "So I just log every response time and analyze them later?"
👨💻 Obito: "Yep! But for real-time tracking, you need open-source monitoring tools."
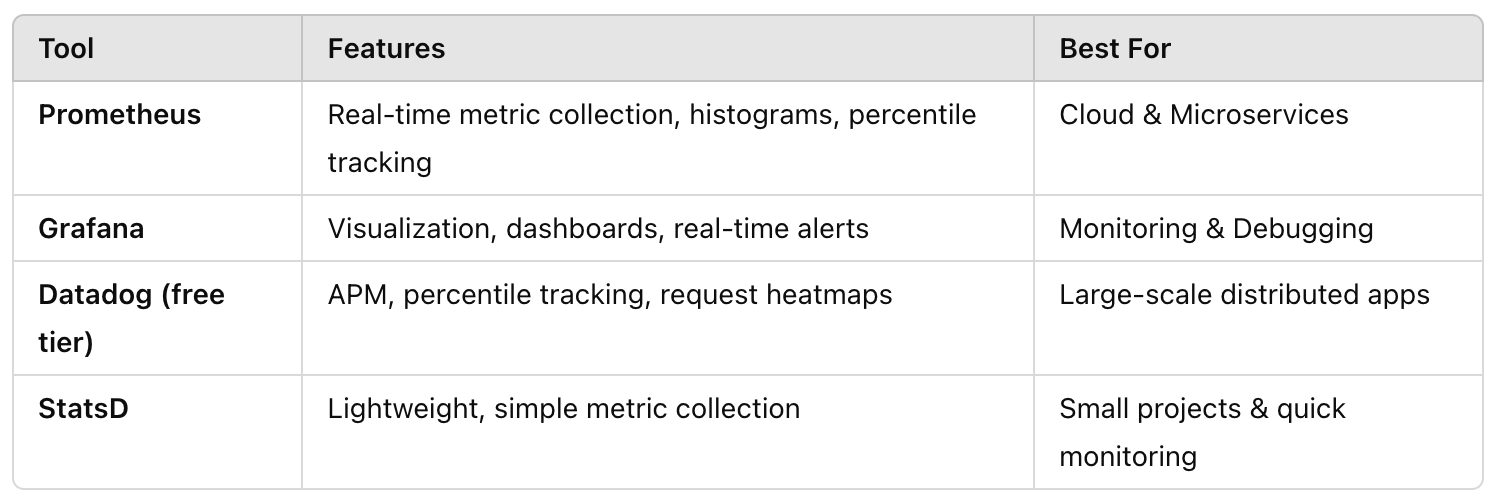
🔍 Best Open-Source Tools for Percentile Tracking
👩💻 Rin: "What’s the easiest way to track p50, p90, and p99?"
👨💻 Obito: "Use these open-source tools to do the heavy lifting!"
👩💻 Rin: "How does Prometheus track p99?"
👨💻 Obito: "You define a histogram metric and let Prometheus calculate percentiles."
📌 Example: Prometheus Histogram for API Latency
api_request_duration_seconds_bucket{le="0.1"} 2567
api_request_duration_seconds_bucket{le="0.5"} 5890
api_request_duration_seconds_bucket{le="1"} 7845
api_request_duration_seconds_bucket{le="2"} 9402
api_request_duration_seconds_count 10000
api_request_duration_seconds_sum 12543
🎯 Key Takeaways: When to Use Each Metric
✅ p50 (Median): When you want to see typical user experience.
✅ p90: When checking how slow users are affected.
✅ p99: When finding outliers & worst-case performance.
✅ p99.9: When every millisecond counts (finance, gaming, trading).
👩💻 Rin: "So if I only monitor p50, I might think my system is fine while users suffer?"
👨💻 Obito: "Exactly! p99 shows you where performance truly breaks down."
🚀 Final Thoughts & Next Steps
👩💻 Rin: "Okay, I get it now—percentiles tell the real story."
👨💻 Obito: "Yep! If you’re serious about latency monitoring, never trust averages."
📌 Next Steps:
✅ Instrument your code to measure latency.
✅ Use Prometheus + Grafana for percentile tracking.
✅ Alert on p99 spikes to catch real performance issues.
🔗 What’s Next on BinaryBanter?
📌 Coming Soon: Latency Optimization—How to Reduce p99 Spikes
🚀 Follow BinaryBanter on Substack, Medium | 💻 Learn. Discuss. Banter.