

⚡ Latency Optimization—How to Reduce p99 Spikes
Your API is fast... for most users. But what about the unlucky 1%?


✅ p50 is great.
✅ p90 looks solid.
🚨 p99? 5-second response times? Users are suffering.
In this article, Obito & Rin will uncover:
✅ Why p99 spikes happen
✅ How to diagnose performance bottlenecks
✅ Best practices to keep p99 latency low
✅ Tools for real-time monitoring & optimization
👩💻 Rin: "Obito, our API feels fast, but users keep complaining about slow responses. The logs show p99 latency is spiking. What’s going on?"
👨💻 Obito: "Ah, the classic "Works on my machine" problem. p50 might be fine, but if p99 spikes, some users are having a terrible experience. Let’s debug this."
🚨 Why Do p99 Latency Spikes Happen?
👩💻 Rin: "First things first—what actually causes high p99 latency?"
👨💻 Obito: "Great question. Here are the usual suspects:"
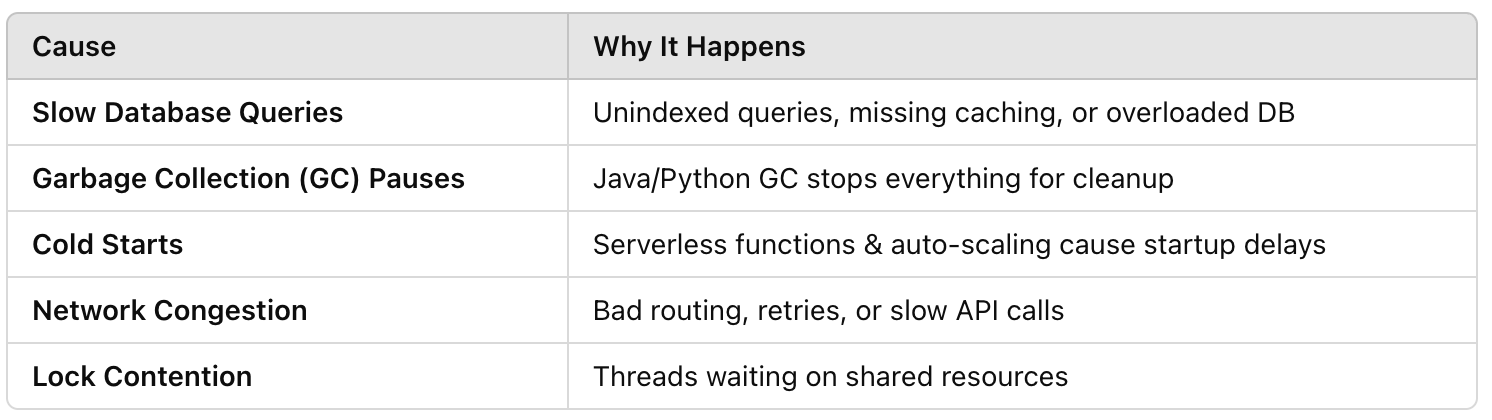
👩💻 Rin: "So p99 spikes aren’t random—they usually mean something is blocking requests."
👨💻 Obito: "Exactly. Now, let’s talk about how to fix it."
🔍 Step 1: Identify the Bottlenecks
👩💻 Rin: "How do we actually find what’s causing high p99?"
👨💻 Obito: "We need real-time profiling & tracing."
🛠️ Tools to Diagnose p99 Spikes
✅ Distributed Tracing (Jaeger, OpenTelemetry) → Find slow requests end-to-end
✅ Profiling (Pyroscope, Flamegraphs) → Identify CPU bottlenecks
✅ Database Query Logs (PgBadger, MySQL Slow Query Log) → Detect slow queries
✅ APM Tools (Datadog, New Relic, Prometheus) → Monitor real-time latency
📌 Example: OpenTelemetry Tracing
tracing:
  enabled: true
  provider: "opentelemetry"
  sampling_rate: 0.1
👩💻 Rin: "So once we find the bottlenecks, what’s next?"
👨💻 Obito: "Now we fix them—starting with databases."
⚡ Step 2: Optimize Database Performance
👩💻 Rin: "A lot of our slow requests hit the database. What can we do?"
👨💻 Obito: "Try these optimizations:"
🔹 1️⃣ Add Proper Indexing
✅ Use EXPLAIN ANALYZE to find missing indexes.
✅ B-Tree vs Hash Indexes → Choose the right index type.
📌 Example: Find Slow Queries in PostgreSQL
EXPLAIN ANALYZE SELECT * FROM users WHERE email = 'test@example.com';🔹 2️⃣ Implement Caching (Redis, Memcached)
✅ Store frequently accessed queries in Redis.
✅ Avoid hitting the DB for repeat requests.
📌 Example: Caching a Query in Redis (Python)
import redis
cache = redis.Redis()

key = "user:123"
if not cache.exists(key):
    user_data = fetch_from_db()
cache.set(key, user_data, ex=3600) # Expire after 1 hour👩💻 Rin: "So caching means we don’t hit the database every time?"
👨💻 Obito: "Exactly! Now, let’s tackle another big one—Garbage Collection (GC)."
♻️ Step 3: Fix Garbage Collection (GC) Pauses
👩💻 Rin: "Our backend is in Python. Can GC cause p99 spikes?"
👨💻 Obito: "Absolutely! GC stops the world while cleaning up memory."
🛠️ How to Reduce GC Impact
✅ Tune GC Settings → Use G1GC for Java, tweak gc.collect() for Python
✅ Reduce Object Allocations → Fewer short-lived objects = less GC overhead
✅ Use P99-Friendly Languages → Golang has no stop-the-world GC pauses
📌 Example: Manually Triggering GC in Python
import gc
gc.disable()  # Reduce automatic GC overhead
gc.collect() # Run GC manually at specific times👩💻 Rin: "So we can control when GC runs to avoid unexpected latency spikes?"
👨💻 Obito: "Exactly! Another trick—use serverless with warm instances to avoid cold starts."
❄️ Step 4: Reduce Cold Start Latency
👩💻 Rin: "Lambda functions in our system sometimes take seconds to respond. Cold starts?"
👨💻 Obito: "Yep. Cold starts hurt p99 big time in serverless architectures."
🛠️ Fixing Cold Start Delays
✅ Keep Warm Instances → Ping functions to prevent them from sleeping
✅ Use Provisioned Concurrency → Preload functions before requests arrive
✅ Choose Faster Runtimes → Golang/Node.js have faster cold starts than Python
📌 Example: AWS Lambda Pre-Warming Script
import requests
def keep_lambda_warm():
    while True:
        requests.get("https://my-lambda-url.com/ping")
        time.sleep(300)  # Ping every 5 minutes
🎯 Step 5: Tune Load Balancing & Auto-Scaling
👩💻 Rin: "Even with optimizations, we get random traffic spikes. How do we handle them?"
👨💻 Obito: "Use smart load balancing & auto-scaling."
✅ Horizontal Scaling (Kubernetes, EC2 Auto Scaling) → Scale up before traffic spikes
✅ Load Shedding → Drop requests when servers are overloaded
✅ Rate Limiting & Backpressure → Prevent single requests from overloading services
📌 Example: Nginx Rate Limiting
limit_req_zone $binary_remote_addr zone=api_limit:10m rate=100r/s;👩💻 Rin: "So instead of overloading our servers, we handle spikes gracefully?"
👨💻 Obito: "Exactly! That’s proactive scaling."
🚀 Final Thoughts
👩💻 Rin: "Okay, so fixing p99 spikes isn’t just one thing—it’s a combination of optimizations."
👨💻 Obito: "Bingo! p99-friendly systems are built with caching, GC tuning, scaling, and proper DB indexing."
📌 Next Steps:
✅ Set up OpenTelemetry for real-time tracing
✅ Optimize database queries & caching
✅ Use smart load balancing & rate limiting
🚀 Stay Tuned for More Banter!
🔹 Want us to deep dive into another programming paradigm or framework? Drop your suggestions!
🚀 Follow BinaryBanter on Substack, Medium | 💻 Learn. Discuss. Banter.